Hey Good Looking! Using Google Visualization
MultiValue systems, particularly those with a long pedigree, can be deep repositories of information — a potentially vital resource in business planning and in understanding historic and future trends. All that is needed is a way to tap that information and present it to the right people, in the right way, at the right time. MultiValue systems can deliver high quality information in many engaging ways and — always close to the hearts of MultiValue users — for relatively little outlay. Take a fresh perspective, add a pinch of imagination, and select a suitable toolset. One such toolset is Google Visualization.
Fig. 1
Why Google?
Google is not the only provider of free, open source visualization software, but their toolkit scores high on a number of counts. First and foremost Google is a name that everyone can recognise, which makes it easier to sell your visualization project both in terms of budget and results. It's also a "safe" name for network administrators, important since the visualization tools are hosted on the Google code servers and downloaded on demand. Second, because the toolkit is structured in a manner that makes it especially easy to use. Third, it is well supported and documented, which is rare for open source projects. And last but not least, it looks good — even on older browsers.
Plumbing for Data
The first challenge is the change in mindset, particularly when it comes to funding. You need to sell your MultiValue application as more than simply a transactional workhorse. It is a resource stuffed full of useful trends and counters — almost anything that varies over time or by volume. You don't need to have a specialised data warehouse or software to plumb these: just regular mvBasic programming with its ability to process complexity and a willingness to go looking for scenarios on which to apply it.
If you work for a commercial organization, you can probably track volumes over time easily enough, but with even some simple programming you can let your imagination run wild. Take a question like customer retention — how many of your clients come back for more, and how often? Is there a pattern? You will be surprised just how many such metrics you can think up in five minutes. Building the data doesn't have to be complex. In most cases it requires no more than a set of phantoms building work files of simple counters against timestamps through the day.
The best thing is that once you start showing your first visualizations, it won't be long before it becomes contagious. Pretty soon you'll be adding breakdowns and applying multipliers and possibly gaining a whole new audience for your applications.
Showing Content
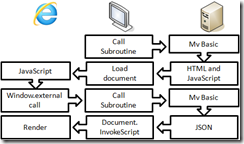
The Google Visualization tools are web based. You can, of course, create web pages in many ways. But if you don't want to get involved in web deployment, a simpler option is to use the WebBrowser control in .NET. This wraps Internet Explorer into a component that can be used in regular Windows forms. This makes is easier to interface with regular APIs such as UniObjects to call server subroutines or to execute commands that return their data as HTML and JavaScript, and to render them as shown in figure 2.
protected void showText(string text){
  try {
      if (webBrowser1.Document == null) {
          webBrowser1.DocumentText = text;
      } else {
          webBrowser1.Document.OpenNew(true);
          webBrowser1.Document.Write(text);
      }

      webBrowser1.Dock = DockStyle.Fill;
   } catch (Exception ex) {
       showError("Error loading page " + ex.Message);
       return;

   }
}
Fig. 2
JavaScript functions executing in the WebBrowser control can call back into your .NET code by using the window.external object. By assigning a class to the ObjectForScripting property of the WebBrowser you can supply a set of static (VB Shared) methods that can be called directly from JavaScript. This means your page can interact with the database directly through your regular transport without the inconveniences of Ajax. Similarly, your .NET code can run JavaScript functions in the browser by calling the InvokeScript method on the current WebBrowser Document, so you have control in both directions.
public void run_js_function(string funcName, string[] args)
{
webBrowser1.Document.InvokeScript(funcName, args);
}
Figure 3 shows a typical lifecycle for a page interacting with the server through the .NET client.
Fig. 3
The Visualization Tools
The Google Visualization tools cover charting, gauges, tables, organizational charts (good for any flowchart style representation) and advanced timelines using a mixture of VML, HTML 5 Canvas, SVG and Adobe Flash, depending on the capabilities of the browser. These tools must be downloaded through the Google loader as a set of packages as follows:
<script type='text/javascript' src='https://www.google.com/jsapi'></script>
<script type='text/javascript'>
google.load('visualization', '1', {packages:['gauge,corechart,annotatedtimeline']});
Because the packages are downloaded asynchronously, it is important that you only try to make use of them once they are ready. You can do this by assigning your own function to be called when the load has completed:
function readyForData(){
// get my charts
window.external.getCharts();
}
google.setOnLoadCallback(readyForData);
Once downloaded, using the tools is very straightforward. The tools provide different features and presentations, but all are drawn against the same underlying data structure and using the same method making it easy to share code between them. The data is held as a DataTable, a simple two dimensional structure of rows and columns. Each tool must be told where on the page it should be drawn — typically they are passed a <div> into which to render. Each tool exposes a draw() method that is passed a DataTable and a dictionary of options:
var place = document.getElementById(divName);
var chart = new google.visualization.PieChart(place);
var options = {width: 400, height: 400};
chart.draw(data, options);
Returning the Chart Data
One of the many nice aspects of JavaScript from a MultiValue perspective is the ease with which you can pass complex structures to and fro. JavaScript objects can be represented using a simple standard notation known as JSON (JavaScript Object Notation). Because MultiValue Basic is so good at string handling, it is easy to format any data you pass back to your client into a JSON representation inside your subroutines. This then saves a world of work parsing these on the client side. Although some browsers have built in JSON parsing, you may need to download a parser to include in your page — the most popular is probably the json2.js parser by Douglas Crockford, available from www.json.org .
Using JSON you can neatly encode a JavaScript object to represent your chart data (fig. 4).
SUBROUTINE test_chart(ChartInfo)

ChartInfo = \{"chartType":"bar"\
ChartInfo<2> = \"cols":["Months","Values"]\
ChartInfo<3> = \"colTypes":["string","number"]\
ChartInfo<4> = \"series":[["Jan","Feb","Mar"],[10,20,30]]}\

Convert @FM To "," In ChartInfo
RETURN

and you can then build your DataTable with ease:
function buildTable(chartData) {
        var data = new google.visualization.DataTable();
        var noCols = chartData.cols.length;
        var noSeries = chartData.series.length;
        var noRows = chartData.series[0].length;

        for(var i = 0; i < noCols; i++){
            data.addColumn(chartData.colTypes[i],chartData.cols[i]);
        }

        data.addRows(noRows);

        for(var i = 0; i < noRows; i++){
           for(var j = 0; j < noCols; j++){
              v = chartData.series[j][i];
              if(chartData.colTypes[j] == 'date'){
                data.setValue(i,j,new Date(v + 732 * 86400 * 1000));
              } else{
                if(chartData.colTypes[j] == 'number'){
                  data.setValue(i,j,parseInt(v));
                } else{
                  data.setValue(i,j,v);
                }
              }
            }
         }
         return data;
       }
Fig. 4
Showing Charts and Tables
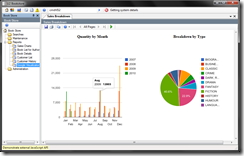
The standard presentation tools are the charts like those in figure 1. Charts come in a number of styles including the familiar pie charts, line, bar and area charts, and some more obscure types. The Google charts present a very clean view of the detail which comes to life as you pass the mouse over their surface. For bar and line charts each additional column of the DataTable creates a new series. You can also use the Google.Visualization.Table to show a (scrolling) table of the data, which is useful in backing up the figures in your graphical representation.
Showing Gauges
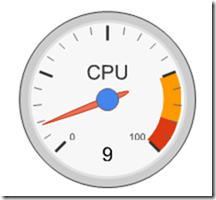
The most striking of the tools is the Gauge (fig. 5). This is a perfect choice for any critical threshold such as disk utilisation or trade flow. The gauge is provided with a value and the thresholds for red, amber and green sections:
Fig. 5
var chart = new google.visualization.Gauge(place);
var options =
{width: 200, height: 200, redFrom: 90, redTo:100, yellowFrom:75, yellowTo: 90, minorTicks: 5};
chart.draw(data, options);
Showing Time Lines
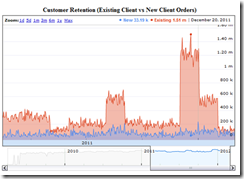
For deeper level of trending or time based series, the outstanding tool is the timeline chart (fig. 6). Unlike the others this is rendered in Flash for a greater degree of interaction.
Fig. 6
Unlike the other tools the timeline must be drawn into a <div> that has an explicit width and height set, and it also requires that the first column of your DataTable holds JavaScript dates. These can be created from MultiValue dates using the following formula:
jsDate = new Date((mvDate + 732) * 86400 * 1000)
The selection area beneath the timeline and the timeline surface lets you scroll up and down the timeline and also increase and decrease the span presented. This makes the timeline a perfect tool for spotting trends and anomalies, in which you can drill into interesting sections of the data.
Next Steps
There are further tools in the Visualization toolkit and plenty more to say about them, but the best option is to simply play with these yourself. Google provides a Code Playground online where you can test out all the features. As you do so you will soon appreciate that these form a powerful and well structured library for representing real information and a great way to freshen up the presentation of your data. And best of all, they are free.


